Reliable and affordable irrigation monitoring, easily scaled across thousands of acres.

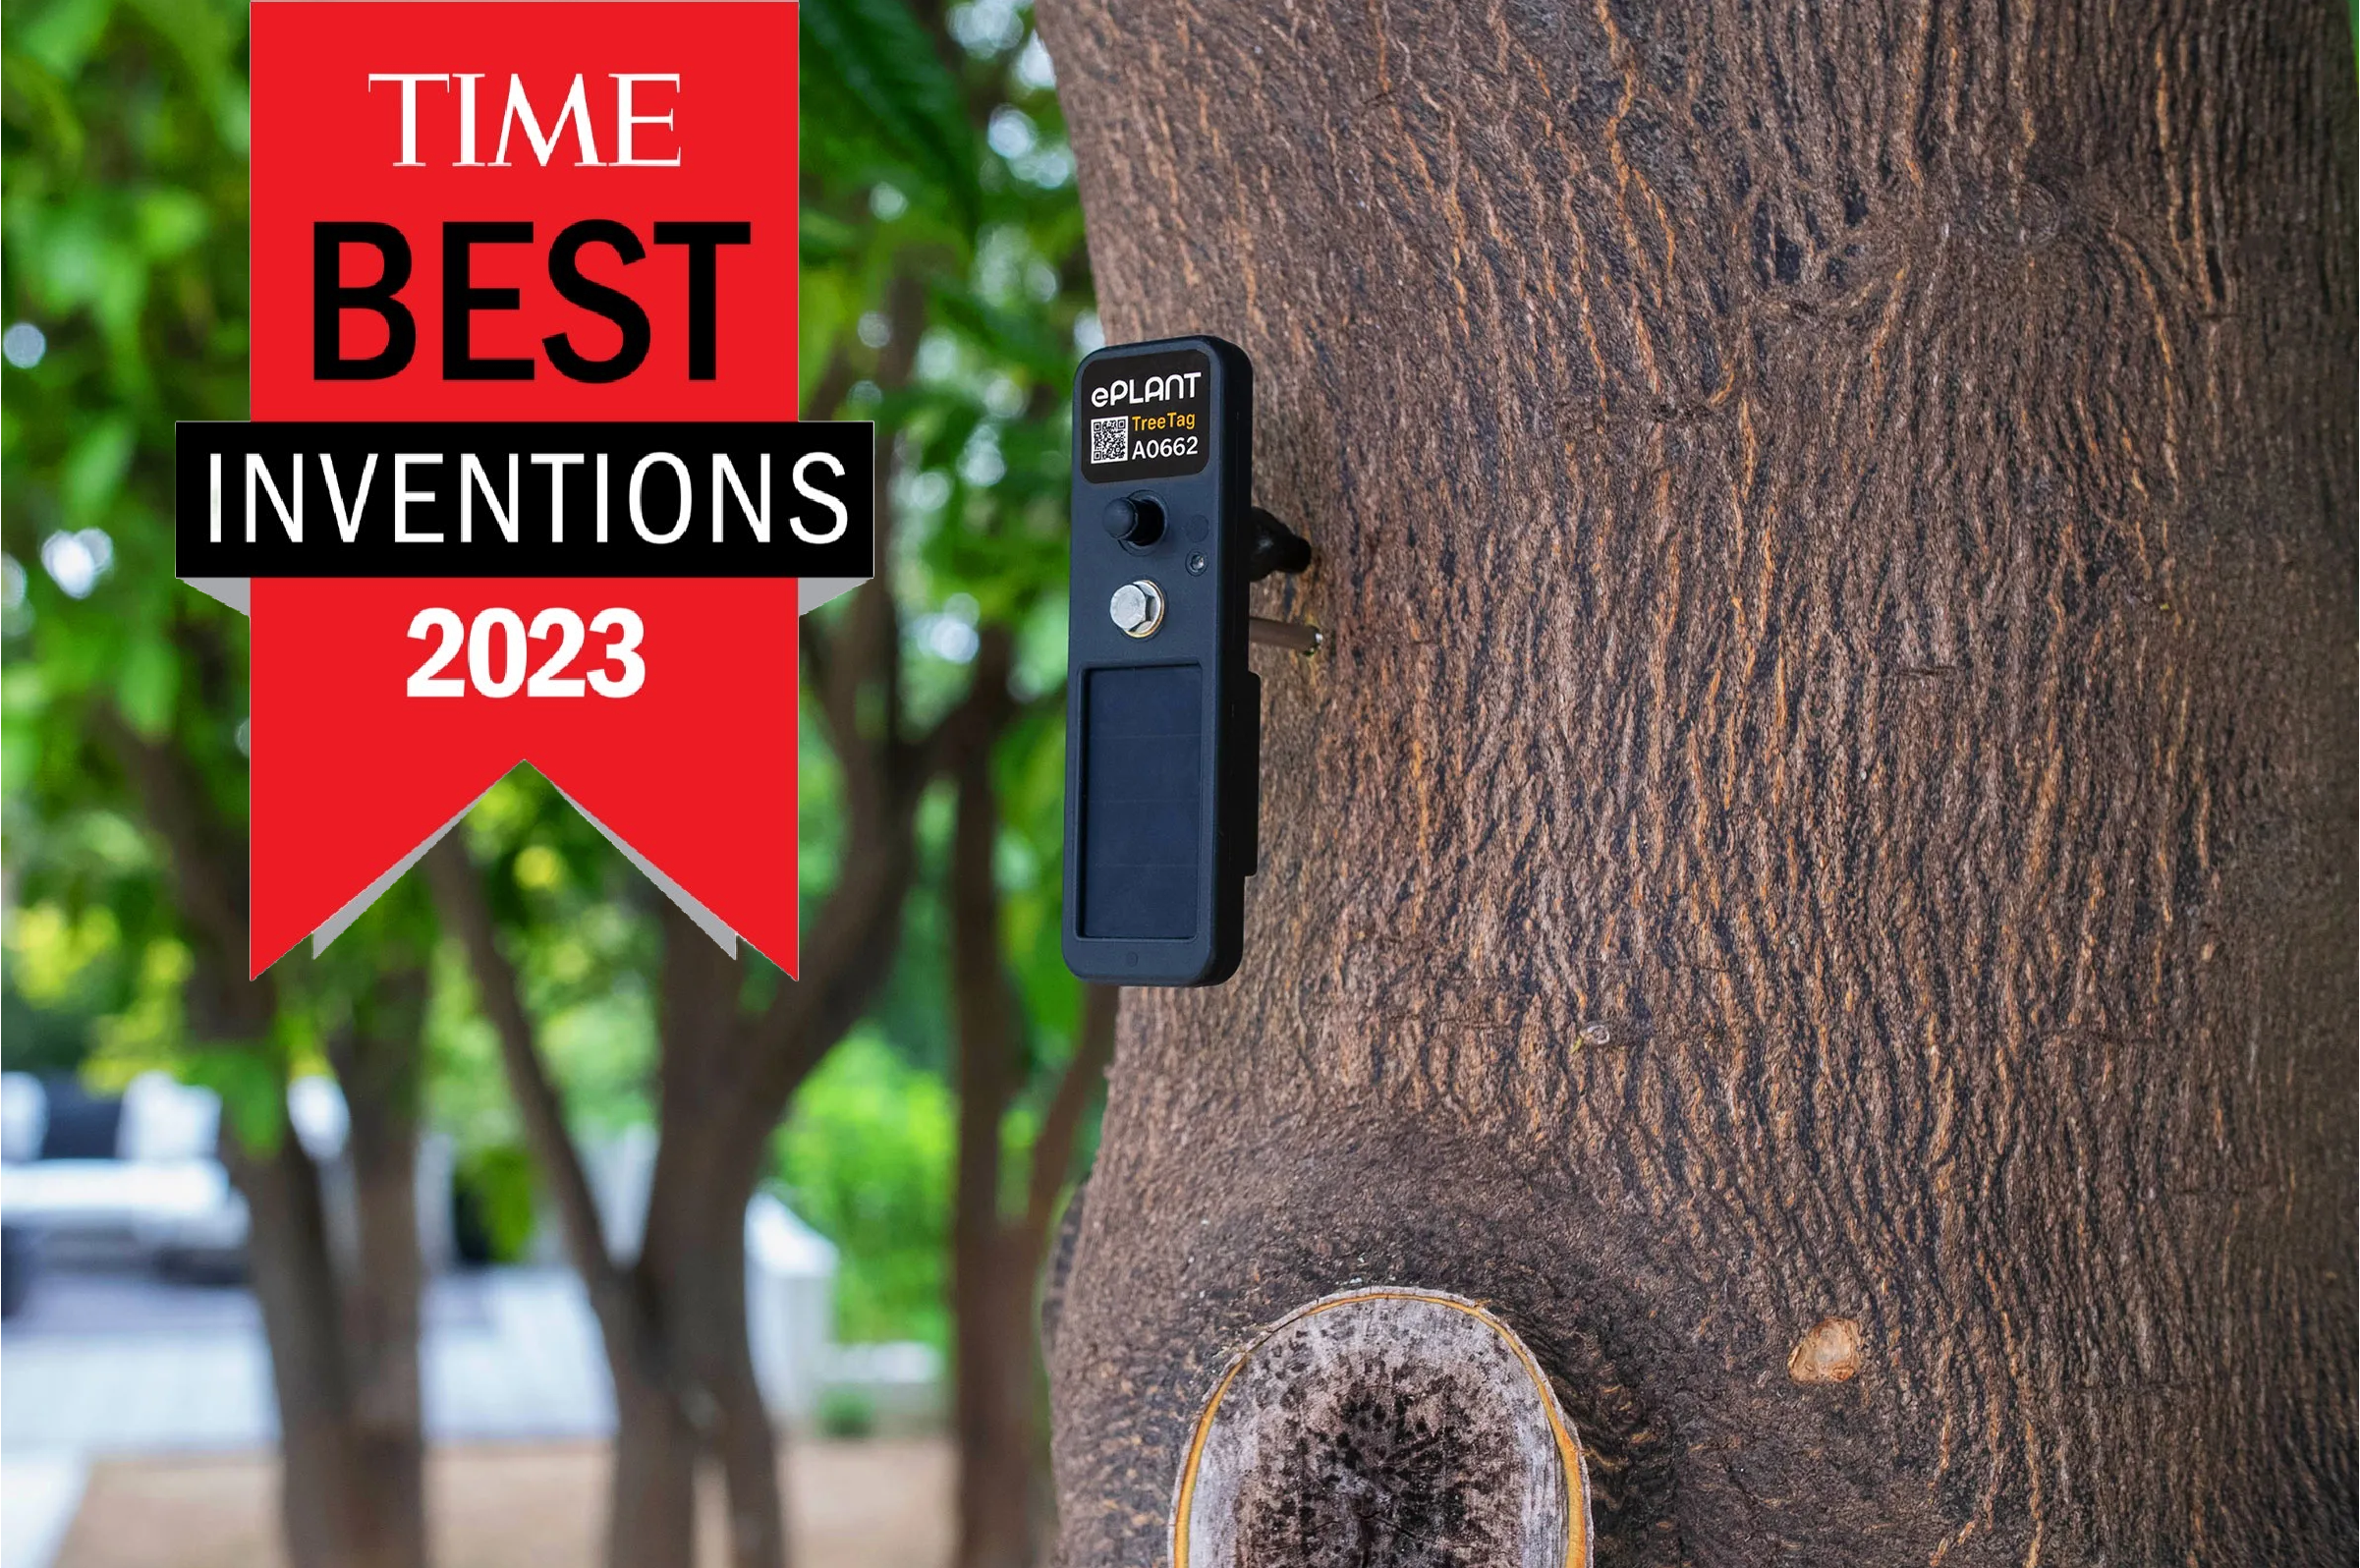
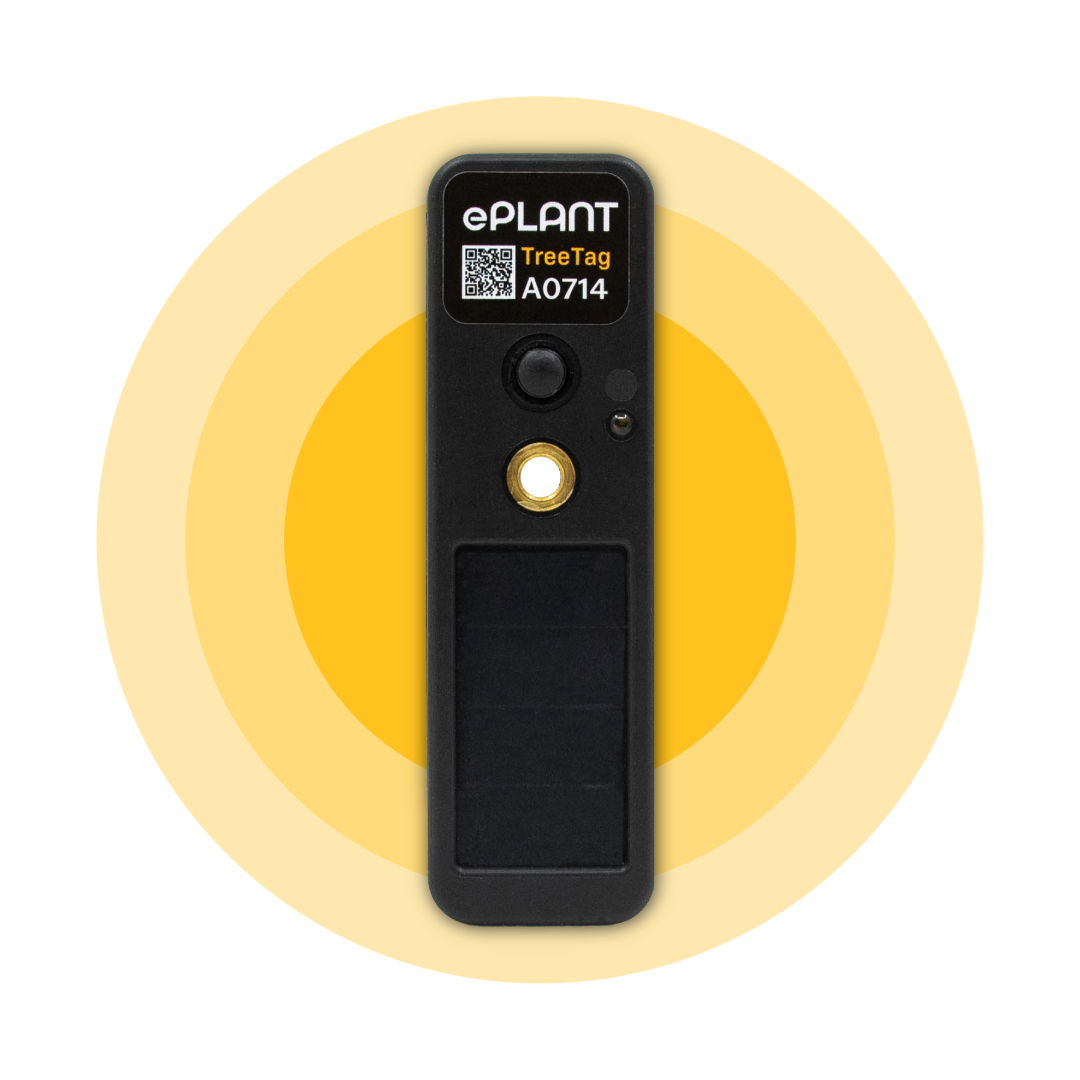
ePlant’s TreeTag is an IoT dendrometer that captures growth and water stress signals directly from trees and vines, delivering a real-time view of crop needs.
With LoRaWAN connectivity and a developer-ready API, TreeTags integrate seamlessly into existing platforms, enabling plant-driven irrigation to scale across your entire operation.
Easier than hanging a picture frame.
Any network. Any gateway. Any way.
Solar-powered, self-sustaining for over a decade.
See stress, growth, and water uptake in real time.
Processed data delivered straight to your platform.
Purpose-built for every orchard and vineyard crop.

TreeTags deliver pre-processed plant data, including irrigation recommendations, that connects effortlessly with your existing systems. With LoRaWAN connectivity and a developer-ready API, integration is seamless. No complex setup, no new infrastructure.
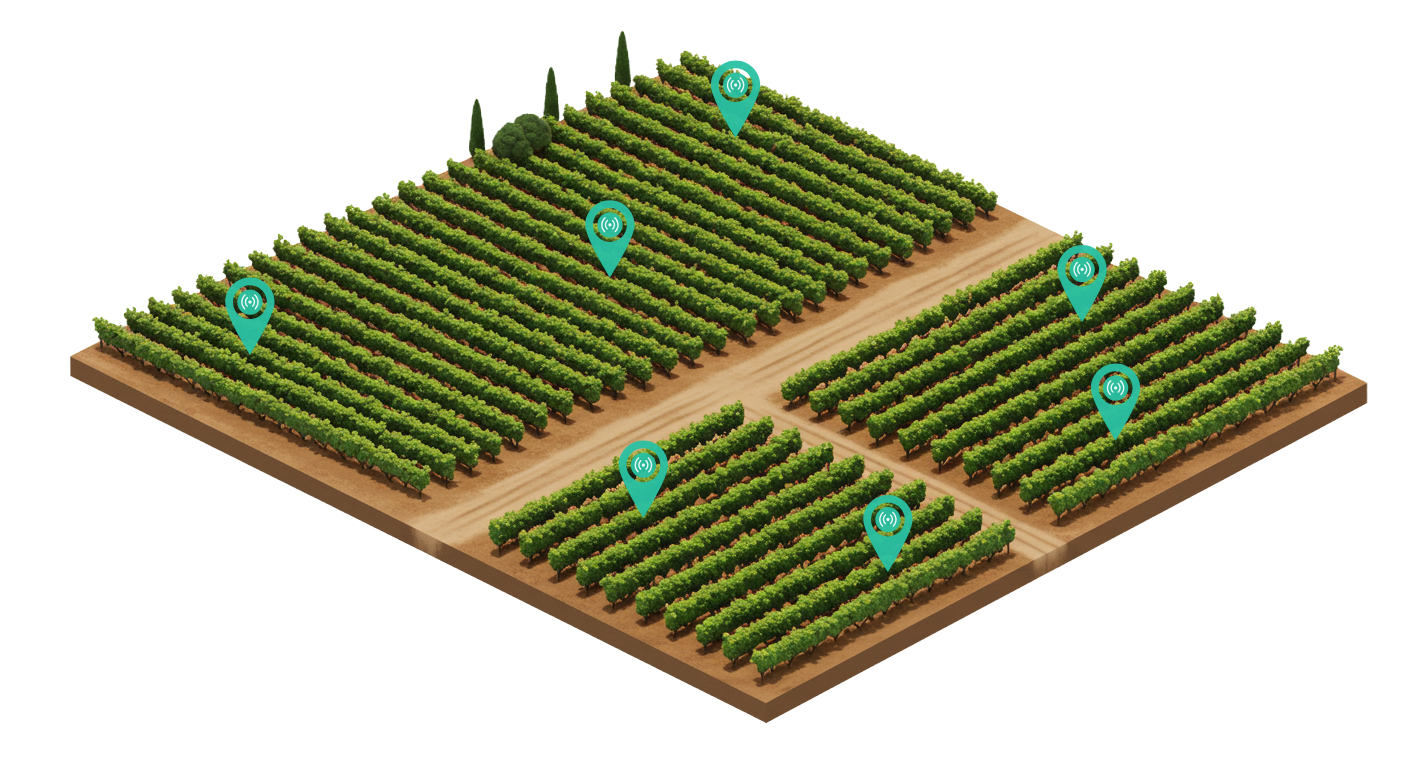
From a single vineyard block to thousands of acres, TreeTags scale instantly, providing plug-and-play datasets that drive smarter irrigation decisions.
TreeTags deliver pre-processed plant data, including irrigation recommendations, that connects effortlessly with your existing systems. With LoRaWAN connectivity and a developer-ready API, integration is seamless: no complex setup, no new infrastructure.
From a single vineyard block to thousands of acres, TreeTags scale instantly, providing plug-and-play datasets that drive smarter irrigation decisions.
Backed by thousands of devices and years of proven reliability in the field.
Backed by thousands of devices and years of proven reliability in the field.
Through our expansive network of innovative partners, TreeTags have provided valuable insights to precision growers worldwide.
Integrate TreeTag data into your irrigation solutions and offer your customers plant-driven precision.
Partner with UsThrough our expansive network of innovative partners, TreeTags have provided valuable insights to precision growers worldwide.
Integrate TreeTag data into your irrigation solutions and offer your customers plant-driven precision.
Partner with Us